Have you ever wondered what the sonic landscape of your favorite music looks like? At SoundCMD Audio Visualizer, we’re constantly exploring innovative ways to bridge the gap between sound and sight. Today, we’re excited to introduce you to one of our latest creations: the Spectrum Heatmap visualization pattern.
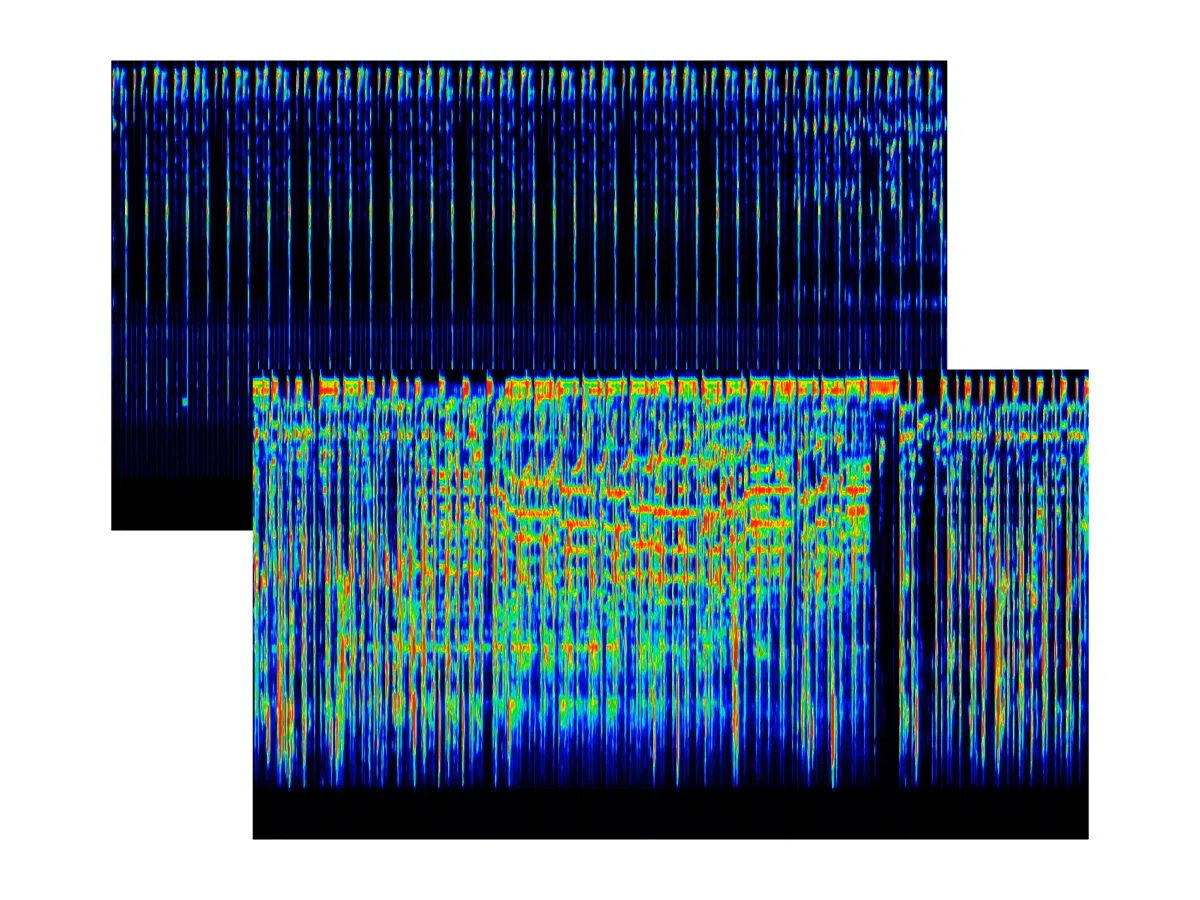
Imagine capturing the entire spectrum of audible frequencies present in a piece of music at any given moment and translating them onto a canvas. This concept lies at the heart of the Spectrum Heatmap. As the music plays, our tool analyzes the audio in real-time, breaking it down into distinct frequency bands. Rather than relying on the traditional bars or lines you might expect, the Spectrum Heatmap transforms the intensity of these frequencies into a vibrant array of colors, creating a visually stunning representation of sound.
How it Works?
With each new audio frame, the frequency analysis is displayed as a vertical slice on the canvas, steadily progressing from left to right over time. For example, quieter frequencies often appear as cooler colors, such as blues and greens. In contrast, more intense frequencies burst forth in warmer hues like yellows, oranges, and reds. As a result, this process creates a dynamic and evolving visual tapestry that vividly represents the shifting energy distribution across the frequency spectrum as the music unfolds.
What Makes Spectrum Heatmap Unique?
The Spectrum Heatmap offers a unique perspective on audio:
- Temporal Evolution: Unlike static displays, it shows how sound frequencies evolve. You see the rise and fall of different sounds.
- Rich Detail: Color changes show even small shifts in sound strength.
- Intuitive Interpretation: “Hotter” colors mean more energy at that sound frequency. It’s simple to see the main sounds and how they change.
- Aesthetic Appeal: Beyond its analytical capabilities, the resulting visuals can be remarkably striking and beautiful. Moreover, they transform sound into a captivating visual experience that engages the senses and evokes deep emotional responses.
See Spectrum Heat-map in Action
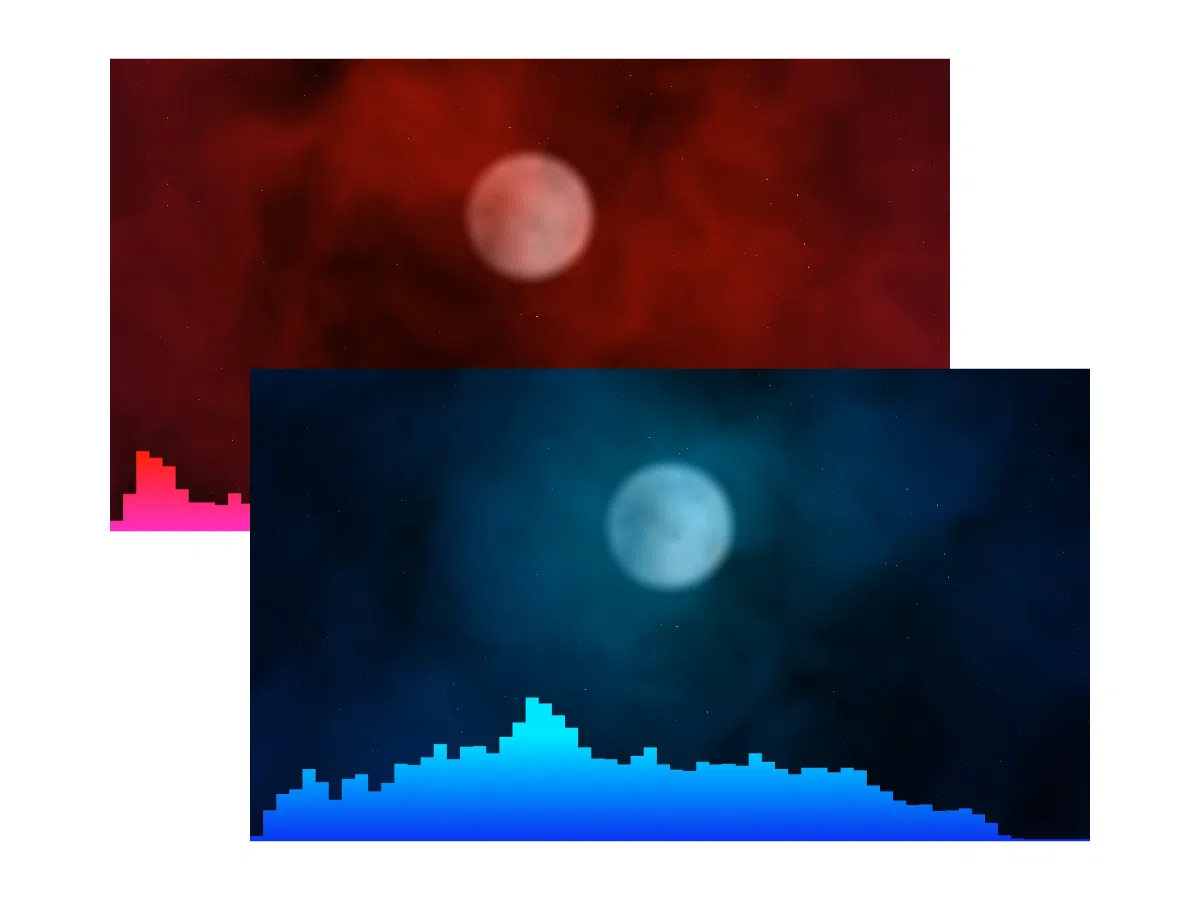
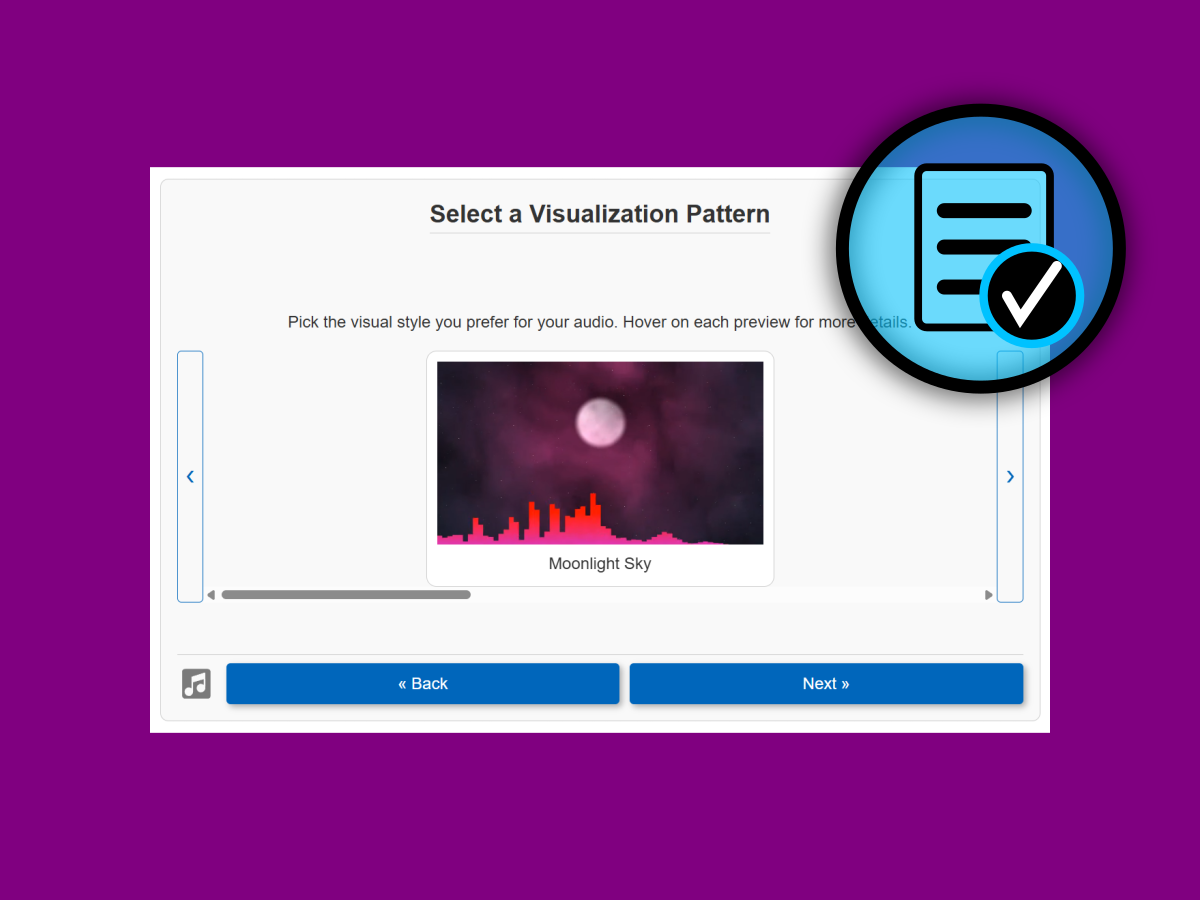
The Spectrum Heatmap is just one of the many ways transform your favorite songs into captivating videos with our Music To Video tool. Whether you’re looking to create mesmerizing music videos or simply want a deeper understanding of the sonic textures of your favorite tracks, our tool offers a range of options to explore.
Ready to Explore More?
If you’re interested in diving deeper into audio visualization, be sure to explore our other resources:
- Audio Tools: Discover a variety of tools designed to enhance your audio experience. Explore Audio Tools.
- Visualization Styles: Learn about different visualization styles and how they can transform your audio into art. Browse the Visualization Styles Collection!
Join us on this journey of sound and sight, and let the Spectrum Heatmap bring your audio to life!


