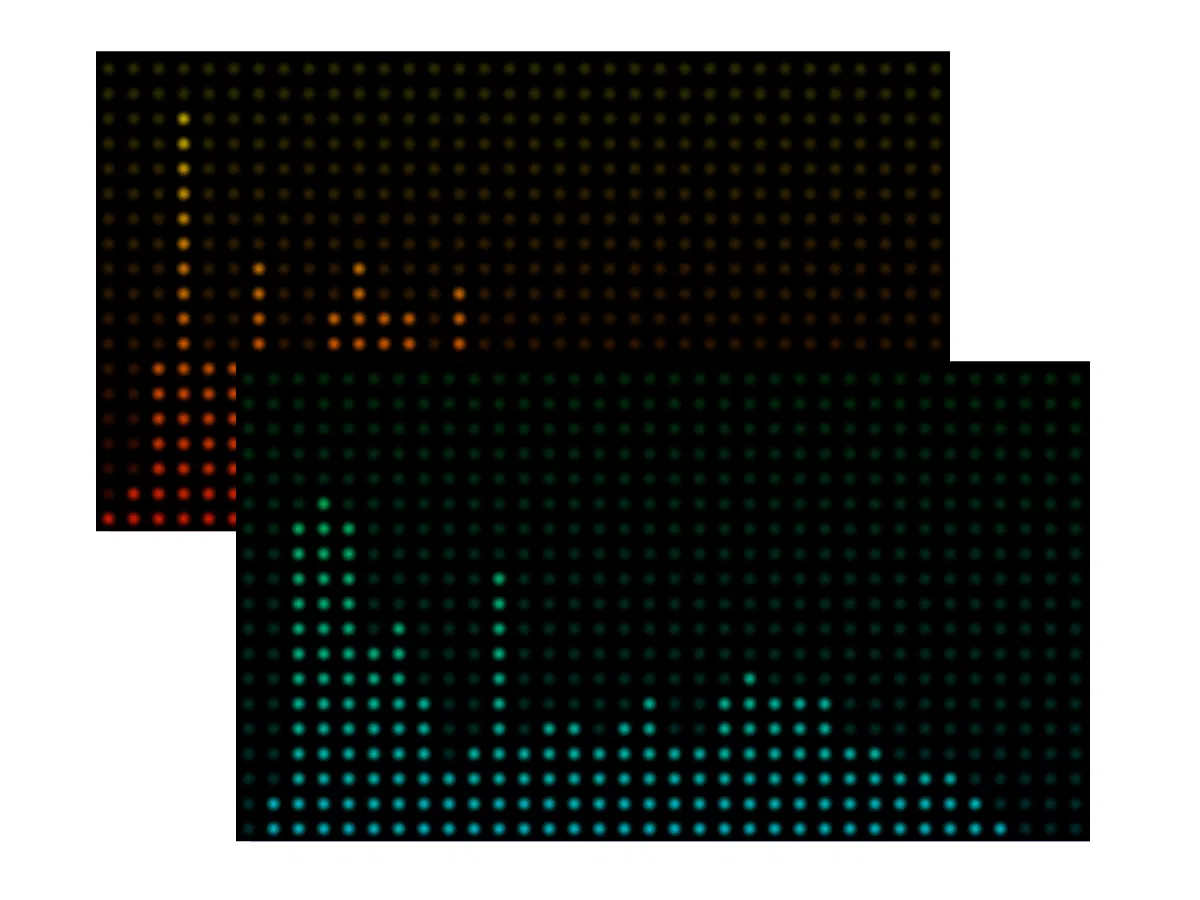
Get ready for a fresh take on audio visualization with our new “Bulb Spectrum” style. This clean and captivating pattern represents the sound spectrum using a series of vibrant, circular segments. Imagine a grid of glowing lights, each pulsing and shifting in color to the rhythm and intensity of your music, creating a visually intuitive and engaging experience.
A Spectrum of Light and Motion
See the sound spectrum in a new way with “Bulb Spectrum.” Instead of solid bars, you’ll see columns of distinct circular segments. As your music plays, these ‘light columns’ pulse with its energy. Consequently, the visualization is easy to understand. Moreover, this mode is efficient for your PC.
Personalize Your Light Spectrum
Like our other styles, “Bulb Spectrum” lets you choose a Primary and a Secondary Color. These colors dynamically apply to the circular segments in each frequency bar. The color shifts from Primary to Secondary based on the frequency band’s power (amplitude). This creates a vibrant visual that clearly shows the music’s intensity across the spectrum. Experiment with different color combinations to highlight your audio’s nuances.
Why Choose Bulb Spectrum?
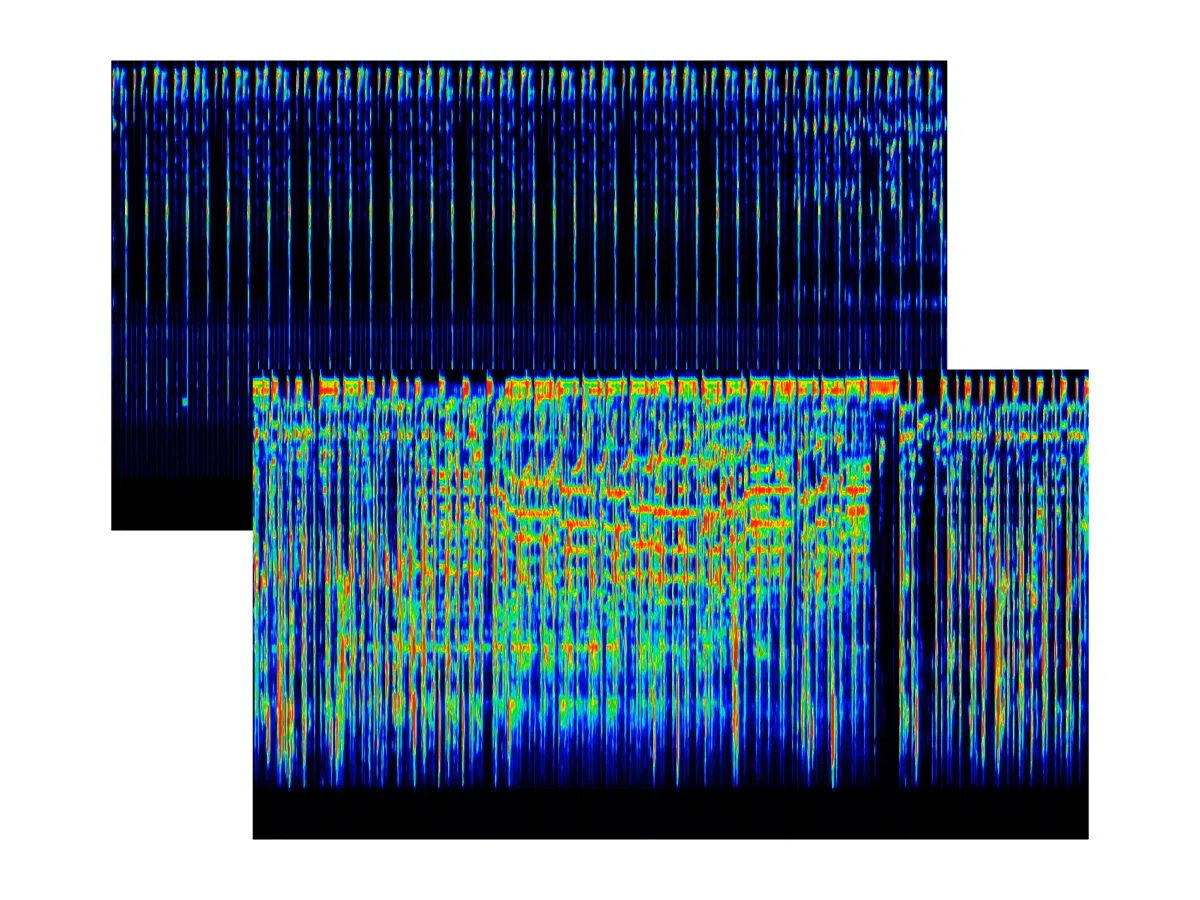
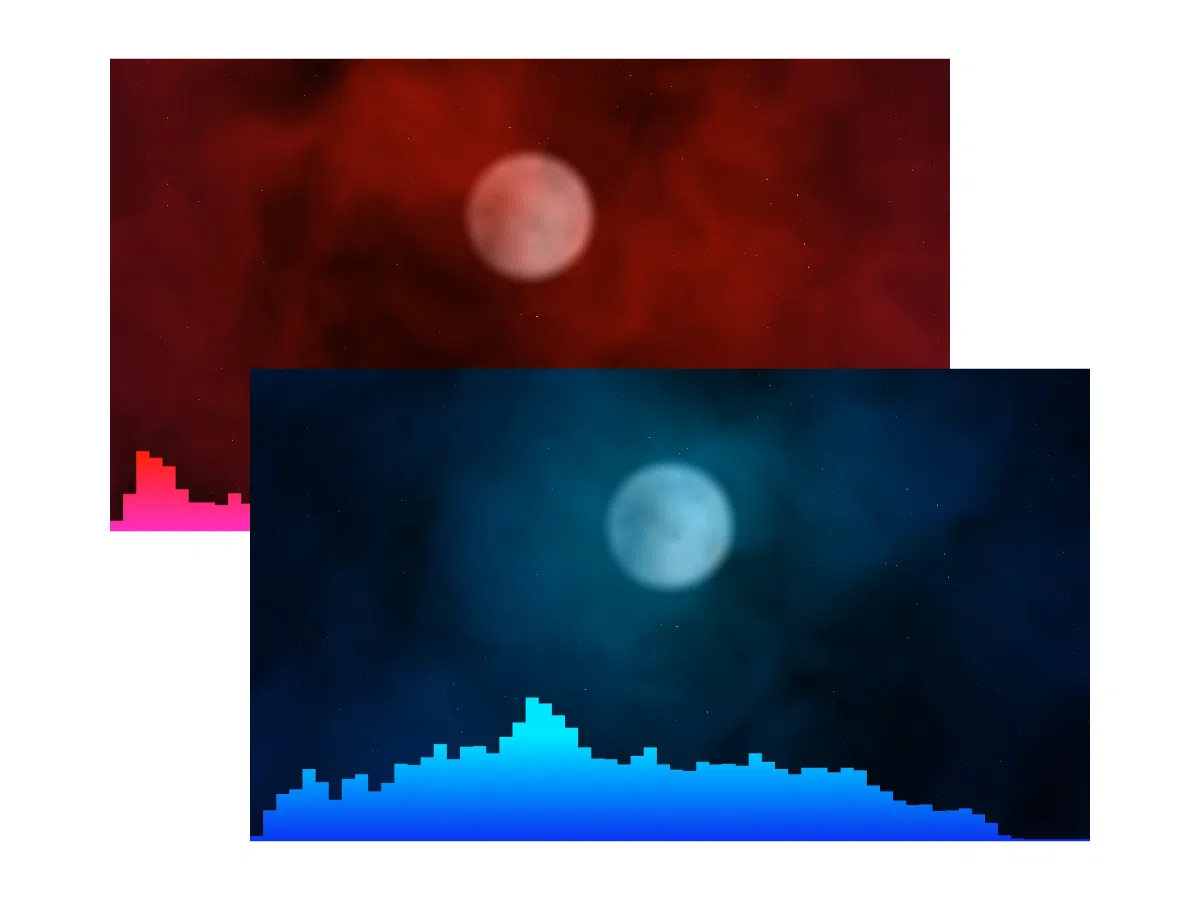
Audio visualization offers many ways to see your music. “Bulb Spectrum” is a fresh, engaging option. It presents the sound spectrum differently than traditional bars or scrolling spectrograms. Instead of solid blocks, you see columns of circular segments. These look clean and almost digital. This style can be great for certain music genres or moods.
This pattern gives you a quick view of the current frequencies with a unique circular design. Furthermore, it renders efficiently and is good for making quick video visualizations. If you want fast WEBM creation featuring clean, bright, and pulsing view of your music’s spectrum, this visualization style might be the perfect fit.
See the Bulb Spectrum in Action
Words can describe the “Bulb Spectrum,” but seeing it pulse and flow with your music truly brings its unique character to life. Check out these short demonstrations showcasing the pattern with different color palettes, visualizing the same piece of audio. Witness how the circular segments dance and how the vibrant gradients respond to the music’s energy.
Ready to experience this vibrant style with your own music?
Conclusion
“Bulb Spectrum” provides a fresh and engaging way to visualize your music’s frequencies. Its clean, circular segments create a captivating display. Furthermore, the dynamic color gradients respond directly to the power of each frequency band, resulting in a visually intuitive and rhythmically appealing experience. Whether you appreciate its distinct aesthetic or need efficient performance, this pattern offers a vibrant new option for your audio visualization toolkit. So, if you’re ready to light up your music in a unique way, head over to our Audio Visualization tool and give “Bulb Spectrum” a try today!


